
This guide provides an intuitive overview of 4 common metrics used to evaluate machine learning classification models: accuracy, recall, specificity, and precision.
Introduction
A binary classifier (test, algorithm, etc.) tries to categorize observations into one of two classes:
- Positives – the class you’re trying to detect
- Negatives – the class you’re trying to avoid
We encounter classification scenarios every day. Some examples include:
![]()
Evaluating a classifier’s performance can be tricky. It’s not as straightforward as saying it got a prediction right or wrong. In fact, there are two ways a prediction can be right, and two ways a prediction can be wrong:
- True Positive – correctly identifying a positive
- True Negative – correctly identifying a negative
- False Positive – incorrectly identifying a positive
- False Negative – incorrectly identifying a negative
A Fishing Excursion
Imagine you’re a fisherman, and you catch tuna for a living. One of the challenges you face is inadvertently catching other creatures, like sea turtles, and risking their lives. As a result, you try to locate a fishing spot which maximizes the number of tuna you catch, while minimizing the number of sea turtles. In this analogy, tuna are the Positive class and sea turtles are the Negative class. The diagram below illustrates two different ways to look at a fishing spot:
![]()
You evaluate your fishing spot based on what you caught and missed. In the figure below, each outcome is illustrated with a different color:
![]()
You can make two types of mistakes. If you missed an opportunity, it’s a False Negative; if you inadvertently went for an error, a False Positive. What’s worse? It depends on the context. In our fishing scenario, a False Positive means you caught a sea turtle in the fishing net, threatening its life, whereas a False Negative means you missed a tuna, losing revenue. If you’re a posh, sustainability-minded fisherman, you might prefer the False Negative. If you’re barely able to feed your family, the False Positive is far better.
In a cancer diagnosis setting, a False Positive means putting someone through unnecessary chemotherapy, while a False Negative means failing to provide treatment for someone who has cancer. One might argue that it’s worse to leave cancer untreated, and thus prioritize minimizing False Negatives.
For a search engine, a False Positive means showing an irrelevant search result, while a False Negative means hiding a relevant search result. A user likely won’t know if a relevant result is missing, but will definitely notice an irrelevant result. From a product standpoint, irrelevant search results would provide a worse user experience; therefore, one would prioritize minimizing False Positives.
When evaluating performance, counts of False Positives and False Negatives are only meaningful if they’re compared with counts of True Positives and True Negatives. Luckily, there are a few common metrics that do exactly that.
The 4 Performance Metrics
1) Accuracy: the percentage of predictions that are correct.
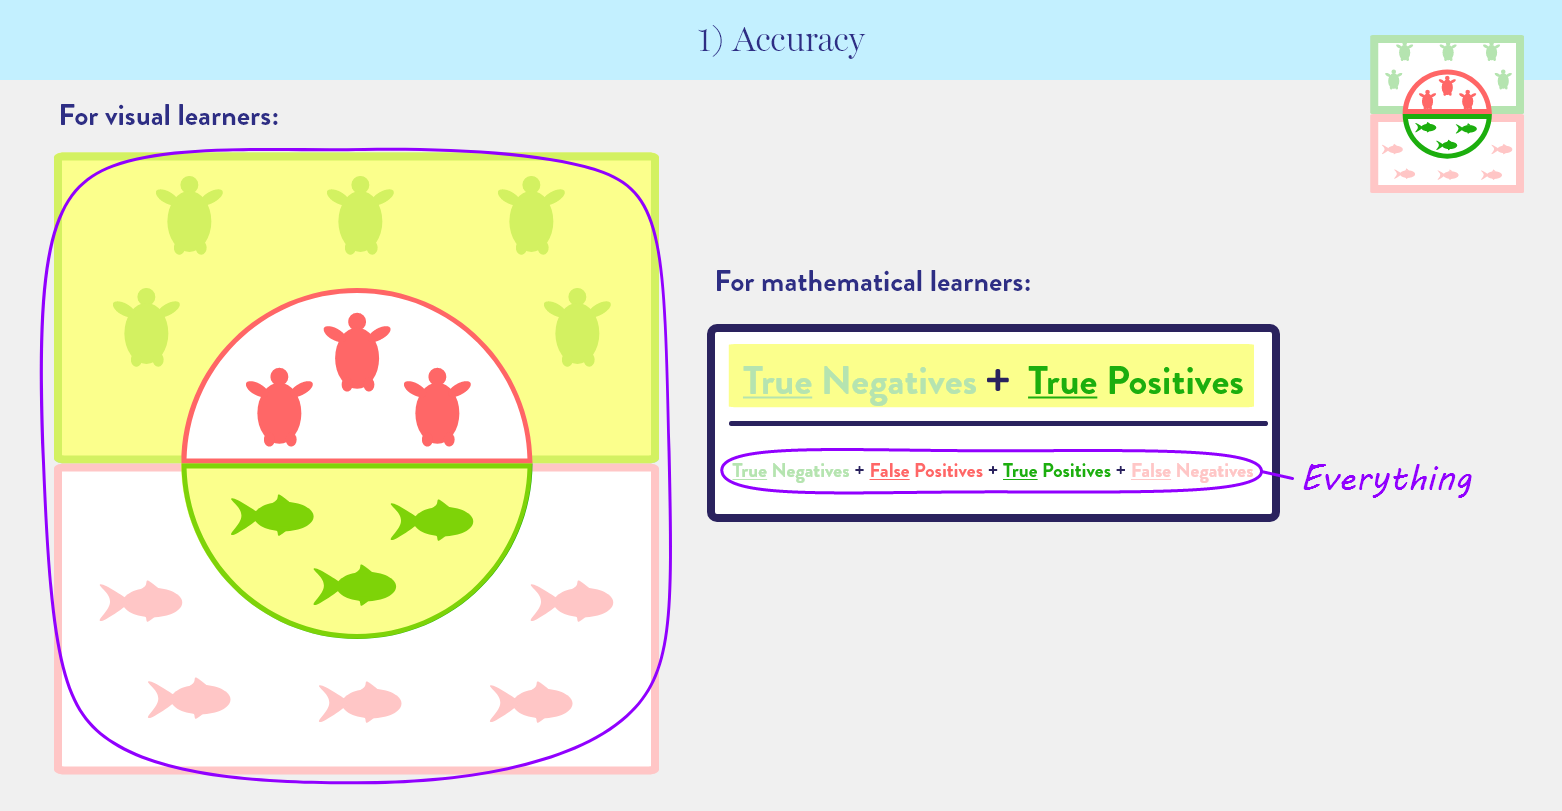
Out of all the creatures in our fishing spot, how many tuna did we catch, and how many sea turtles did we avoid?
Out of all the patients we tested, how many did we correctly diagnose as having cancer or not having cancer?
Accuracy is the simplest metric—and most popular. However, its lack of information about the individual impact of False Positives and False Negatives can be misleading. If there is a class imbalance, where Positives greatly outnumber Negatives or vice versa, accuracy makes performance seem better than it actually is. Consider a fishing spot with 1 tuna and 9 sea turtles. We cast our net and pull in a lone sea turtle. Our accuracy is 80%: 8 sea turtles we avoided (True Negatives) + 0 tuna we caught (True Positive), divided by 10 creatures total. 80% is a pretty good grade for a tuna fisherman who didn’t catch any tuna!
2) Recall or Sensitivity or True Positive Rate*: The percentage of all positives that were correctly predicted as positive. Measures how completely a test or algorithm can identify all possible positives.

Out of all the tuna in the fishing spot, how many did we catch?
Of the patients who have cancer, how many were we able to diagnose?
From a different perspective, recall is a way to measure False Negatives. A low recall means the classifier missed many Positives (i.e., incorrectly called them Negatives), which is equivalent to having many False Negatives.
3) Specificity or True Negative Rate*: the percentage of all negatives that were correctly predicted as negative. Measures how completely a test or algorithm can identify all possible negatives.
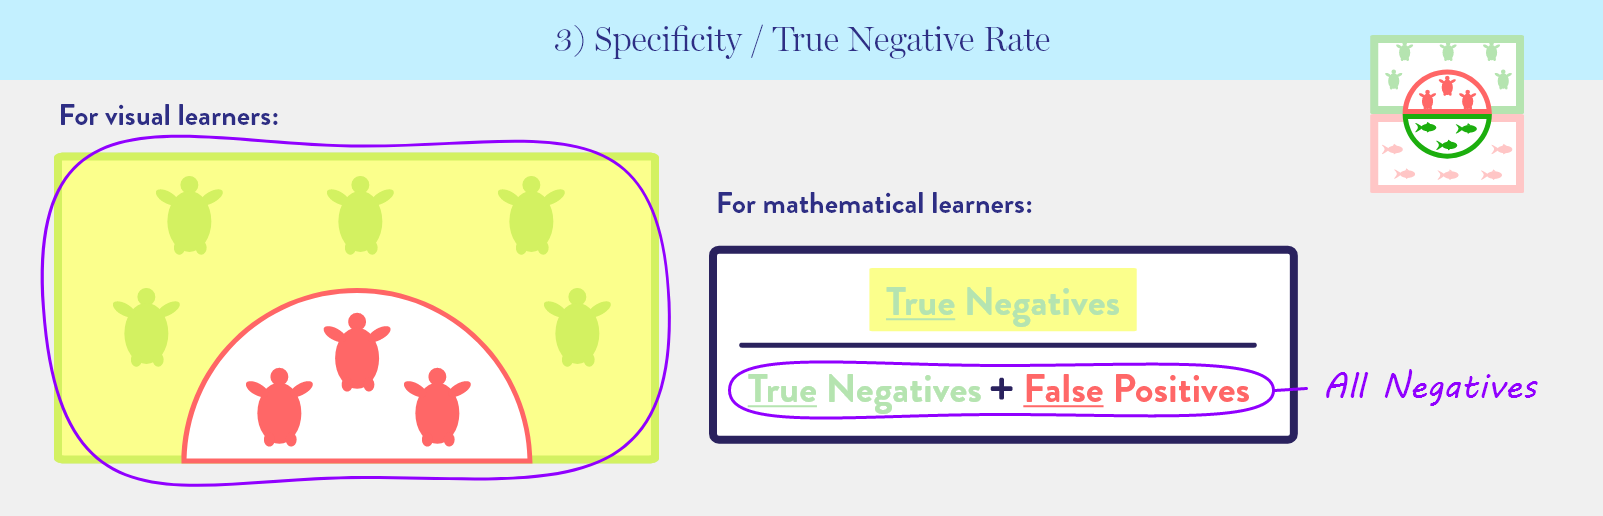
Out of all the sea turtles in our fishing spot, how many did we avoid?
Of the patients without cancer, how many did we diagnose as cancer-free?
Specificity can also be interpreted as a way to measure False Positives. A low specificity means the classifier missed many Negatives (i.e., incorrectly called them Positives), which is equivalent to having many False Positives.
4) Precision or Positive Predictive Value*: the percentage of all positive predictions that are correct. Measures how efficient a test or algorithm is at identifying positives.

How good were we at catching just tuna in our net?
Of all patients that we diagnosed with cancer, how many actually had cancer?
This is another way to measure the impact of False Positives. A low precision means many of the predictions of Positive were incorrect (i.e., should have been Negative), which is equivalent to many False Positives.
Completeness vs. Efficiency
Both 2) recall and 3) specificity measure completeness. Were you able to catch all the tuna? Were you able to avoid all the sea turtles?
On the other hand, 4) precision measures efficiency. For every 10 creatures you caught, how many were tuna? When you catch tuna, do you also accidentally catch a lot of sea turtles?
Common Uses
Many organizations measure recall (“how completely a classifier can identify all possible positives”) and precision (“how efficient a classifier is at identifying positives”) in tandem. They often find the two at odds. Improving one typically reduces the other. For example, we can achieve high precision if we use a small net to decrease the number of sea turtles we catch. But a smaller net also decreases our chance of catching tuna, which results in low recall. Similarly, sensitivity (same as recall) and specificity (“how completely a test or algorithm can identify all possible negatives”) are often measured together, but come out to be at odds. Improving one does not improve the other. Like in the above paragraph, a small net decreases our chance of catching tuna, which results in low recall. However, it also gives us a higher chance of avoiding all the sea turtles, which results in high specificity. In both examples, the opposite is true if we use a large fishing net.
Conclusion
Accuracy, recall, specificity, and precision are commonly used when evaluating the performance of machine learning models, medical tests, and many other binary classification problems. We hope this guide gave you a basic understanding of what these metrics measure.
* This metric goes by any of the listed names, depending on the context. Some examples:
- In a medical context, sensitivity and specificity are often discussed together.
- In machine learning, recall is used with precision, but true positive rate is used with Receiver Operating Curve (ROC).
- Positive predictive value is used in the medical device industry, but precision is used in a machine learning setting.
In general, the pairs you’ll encounter are: sensitivity/specificity, precision/recall, and true positive rate/false positive rate. We know it’s confusing to share so many names for four metrics, but we want to make sure you’re aware of them, so you won’t be confused (like we were, at first!) when they come up.